WeatherPy: Latitude and Weather
 WeatherPy examines and visualizes the weather of more than 500 cities by latitude
(distance from the equator).
First, WeatherPy randomly selects over 500 unique cities by latitude and longitude.
Starting from a list of 1500 randomly generated latitudes and longitudes, it uses the
citipy Python library
to find the nearest city, returning approximately 600 unique cities.
Next, WeatherPy queries the
OpenWeatherMap API
for weather for each city by using the
openweathermapy Python wrapper.
Using Python exception handling for cities not found in the OpenWeatherMap database results in
weather data for over 500 unique cities which is then saved to a csv.
It then uses pandas
to extract the relevant data and combine it in a data frame.
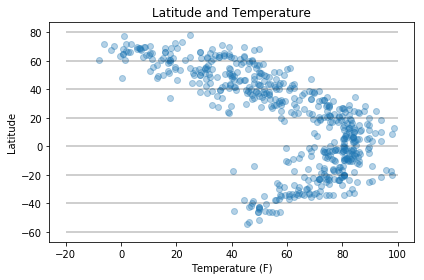
Finally, WeatherPy creates
matplotlib
scatter plots comparing temperature (F), humidity %, cloudiness %,
and wind speed (MPH) to latitude, saving a copy of each plot.
WeatherPy's plots invert the typical orientation of independent and dependent variables (x v. y).
The independent variable is diplayed on the y-axis in order to differentiate
the horizontal lines of latitude from vertical lines of longitude.
WeatherPy examines and visualizes the weather of more than 500 cities by latitude
(distance from the equator).
First, WeatherPy randomly selects over 500 unique cities by latitude and longitude.
Starting from a list of 1500 randomly generated latitudes and longitudes, it uses the
citipy Python library
to find the nearest city, returning approximately 600 unique cities.
Next, WeatherPy queries the
OpenWeatherMap API
for weather for each city by using the
openweathermapy Python wrapper.
Using Python exception handling for cities not found in the OpenWeatherMap database results in
weather data for over 500 unique cities which is then saved to a csv.
It then uses pandas
to extract the relevant data and combine it in a data frame.
Finally, WeatherPy creates
matplotlib
scatter plots comparing temperature (F), humidity %, cloudiness %,
and wind speed (MPH) to latitude, saving a copy of each plot.
WeatherPy's plots invert the typical orientation of independent and dependent variables (x v. y).
The independent variable is diplayed on the y-axis in order to differentiate
the horizontal lines of latitude from vertical lines of longitude.